
State and Local Sales Tax Rates 2022
One of the more open methods of tax revenue collection is through retail sales taxes. Sales taxes are simpler to understand because customers can see their tax liability printed right on their receipts, whereas graduated income tax rates and brackets are complex and difficult for many taxpayers to understand.
Also Read:-How the Government Makes Money
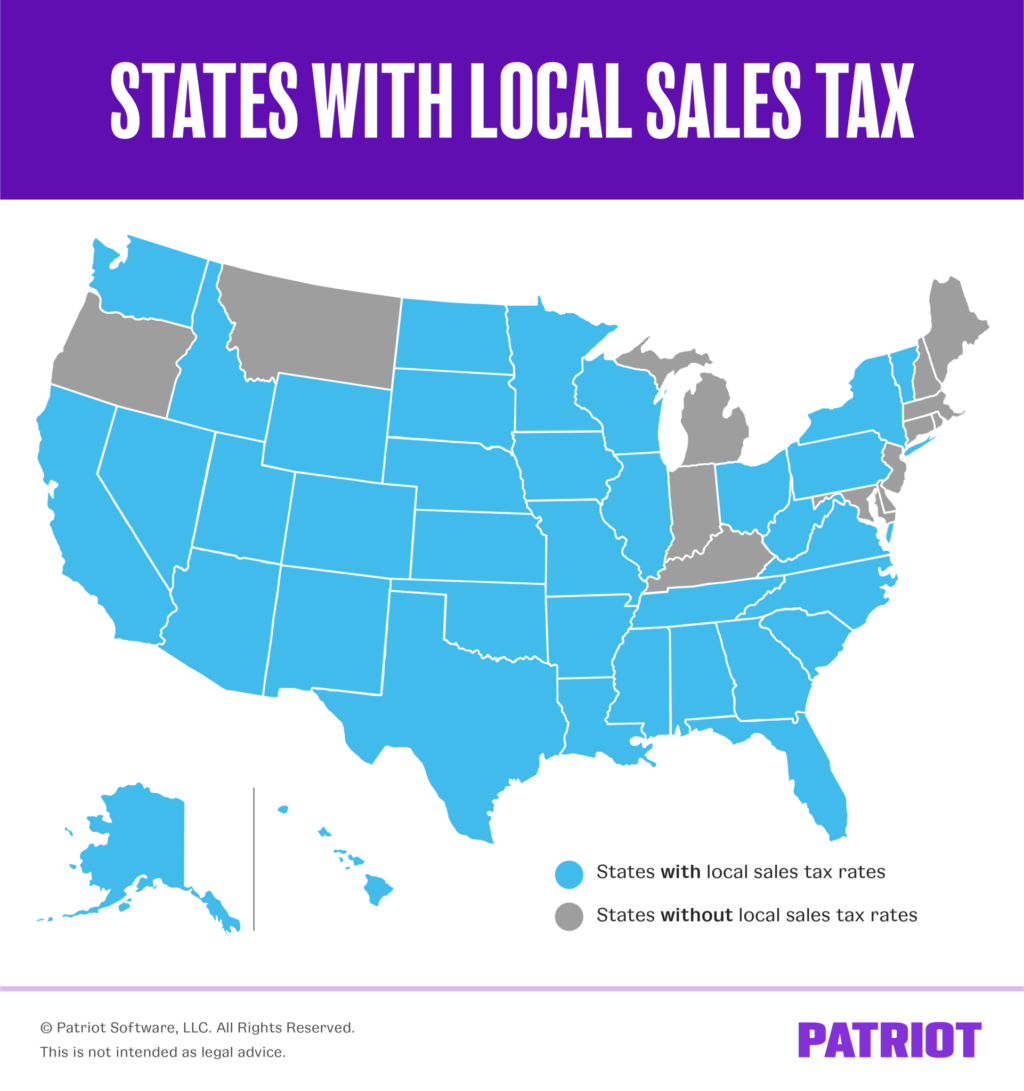
In 38 states, shoppers must also pay municipal sales taxes in addition to state-level ones. A state with a modest statewide sales tax rate may actually have a very high combined state and local rate when compared to other states because these rates can be rather high. To provide readers an idea of the typical local rate for each state, this report presents a population-weighted average of local sales taxes as of January 1, 2022. The full breakdown of state and local sales tax rates is shown in Table 1.
State & Local Sales Tax Rates, as of January 1, 2022
| State | State Tax Rate | Rank | Avg. Local Tax Rate (a) | Combined Rate | Rank | Max Local Tax Rate |
|---|---|---|---|---|---|---|
| Alabama | 4.00% | 40 | 5.24% | 9.24% | 5 | 7.50% |
| Alaska | 0.00% | 46 | 1.76% | 1.76% | 46 | 7.50% |
| Arizona | 5.60% | 28 | 2.80% | 8.40% | 11 | 5.60% |
| Arkansas | 6.50% | 9 | 2.97% | 9.47% | 3 | 6.125% |
| California (b) | 7.25% | 1 | 1.57% | 8.82% | 7 | 2.50% |
| Colorado | 2.90% | 45 | 4.87% | 7.77% | 16 | 8.30% |
| Connecticut | 6.35% | 12 | 0.00% | 6.35% | 33 | 0.00% |
| Delaware | 0.00% | 46 | 0.00% | 0.00% | 47 | 0.00% |
| D.C. | 6.00% | (17) | 0.00% | 6.000% | (38) | 0.00% |
| Florida | 6.00% | 17 | 1.01% | 7.01% | 23 | 2.00% |
| Georgia | 4.00% | 40 | 3.35% | 7.35% | 19 | 4.90% |
| Hawaii (c) | 4.00% | 40 | 0.44% | 4.44% | 45 | 0.50% |
| Idaho | 6.00% | 17 | 0.02% | 6.02% | 37 | 3.00% |
| Illinois | 6.25% | 13 | 2.56% | 8.81% | 8 | 4.75% |
| Indiana | 7.00% | 2 | 0.00% | 7.00% | 24 | 0.00% |
| Iowa | 6.00% | 17 | 0.94% | 6.94% | 28 | 1.00% |
| Kansas | 6.50% | 9 | 2.20% | 8.70% | 9 | 4.00% |
| Kentucky | 6.00% | 17 | 0.00% | 6.00% | 38 | 0.00% |
| Louisiana | 4.45% | 38 | 5.10% | 9.55% | 1 | 7.00% |
| Maine | 5.50% | 29 | 0.00% | 5.50% | 42 | 0.00% |
| Maryland | 6.00% | 17 | 0.00% | 6.00% | 38 | 0.00% |
| Massachusetts | 6.25% | 13 | 0.00% | 6.25% | 35 | 0.00% |
| Michigan | 6.00% | 17 | 0.00% | 6.00% | 38 | 0.00% |
| Minnesota | 6.875% | 6 | 0.61% | 7.49% | 17 | 2.00% |
| Mississippi | 7.00% | 2 | 0.07% | 7.07% | 22 | 1.00% |
| Missouri | 4.225% | 39 | 4.06% | 8.29% | 12 | 5.763% |
| Montana (d) | 0.00% | 46 | 0.00% | 0.00% | 47 | 0.00% |
| Nebraska | 5.50% | 29 | 1.44% | 6.94% | 29 | 2.50% |
| Nevada | 6.85% | 7 | 1.38% | 8.23% | 13 | 1.53% |
| New Hampshire | 0.00% | 46 | 0.00% | 0.00% | 47 | 0.00% |
| New Jersey (e) | 6.625% | 8 | -0.03% | 6.60% | 30 | 3.313% |
| New Mexico (c) | 5.125% | 32 | 2.71% | 7.84% | 15 | 4.313% |
| New York | 4.00% | 40 | 4.52% | 8.52% | 10 | 4.875% |
| North Carolina | 4.75% | 35 | 2.23% | 6.98% | 26 | 2.75% |
| North Dakota | 5.00% | 33 | 1.96% | 6.96% | 27 | 3.50% |
| Ohio | 5.75% | 27 | 1.47% | 7.22% | 20 | 2.25% |
| Oklahoma | 4.50% | 36 | 4.47% | 8.97% | 6 | 7.00% |
| Oregon | 0.00% | 46 | 0.00% | 0.00% | 47 | 0.00% |
| Pennsylvania | 6.00% | 17 | 0.34% | 6.34% | 34 | 2.00% |
| Rhode Island | 7.00% | 2 | 0.00% | 7.00% | 24 | 0.00% |
| South Carolina | 6.00% | 17 | 1.44% | 7.44% | 18 | 3.00% |
| South Dakota (c) | 4.50% | 36 | 1.90% | 6.40% | 32 | 4.50% |
| Tennessee | 7.00% | 2 | 2.55% | 9.55% | 2 | 2.75% |
| Texas | 6.25% | 13 | 1.95% | 8.20% | 14 | 2.00% |
| Utah (b) | 6.10% | 16 | 1.09% | 7.19% | 21 | 2.95% |
| Vermont | 6.00% | 17 | 0.24% | 6.24% | 36 | 1.00% |
| Virginia (b) | 5.30% | 31 | 0.45% | 5.75% | 41 | 0.70% |
| Washington | 6.50% | 9 | 2.79% | 9.29% | 4 | 4.00% |
| West Virginia | 6.00% | 17 | 0.52% | 6.52% | 31 | 1.00% |
| Wisconsin | 5.00% | 33 | 0.43% | 5.43% | 43 | 1.75% |
| Wyoming | 4.00% | 40 | 1.22% | 5.22% | 44 | 2.00% |
Conclusion
Sales taxes should be taken into account in the context of a larger tax system. For instance, Oregon has no sales tax but high income taxes, whereas Tennessee has high sales taxes but no income tax. Sales taxes are something that politicians can regulate and can have immediate effects, even though many factors affect where businesses locate and where investors choose to invest.